
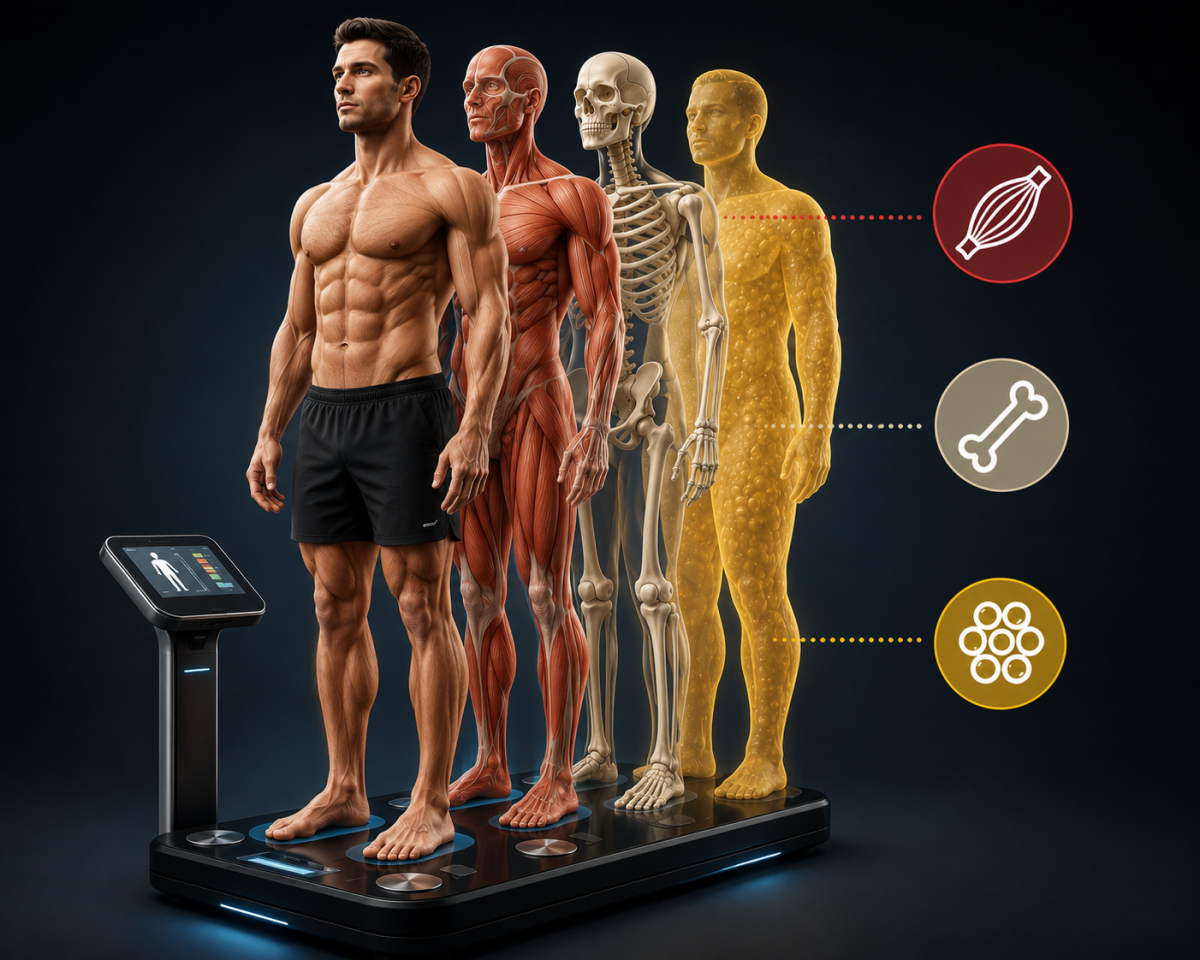
What Do Body Composition Numbers Mean?
Simple, practical, no-panic explanations for the numbers commonly produced during a body composition scan.
Firstly, Let’s Be Clear
ALL data is relative. Comparing your results to anyone else is largely fruitless.
Your body composition is influenced by:
- Genetics
- Age
- Gender
- Frame size
- Hydration
- Sleep
- Stress
- Lifestyle
- Training history
These assessments are best used as:
- ✅ A point of discussion
- ✅ A lifestyle snapshot
- ✅ A way to track trends over time
Weight (kg)
Your total body weight reflects everything combined — muscle, body fat, bone, water, food/fluid intake and hydration status.
Your weight can fluctuate daily depending on sleep quality, stress, travel, training load, hydration, time of day and nutrition intake.
While many people focus heavily on body weight, I personally place greater value on waist circumference, waist-to-height ratio, muscle mass, energy levels, movement quality and metabolic health markers.
BMI — Body Mass Index
BMI simply compares weight relative to height.
While commonly used globally, BMI has major limitations because it does not consider muscle mass, frame size, or the difference between lean tissue and body fat.
For example:
- A muscular athlete may score “overweight”.
- An inactive person with low muscle may score “healthy”.
Waist-to-Height Ratio
This is one of the more useful and practical health markers. It simply compares your waist measurement relative to your height.
- Lower ratios are generally associated with better metabolic health.
- Higher ratios may reflect increased abdominal fat storage.
| Waist-to-Height Ratio | Broad Guide |
|---|---|
| Under 0.50 | Generally favourable |
| 0.50 – 0.59 | Working on it |
| 0.60+ | Increased health risk consideration |
Waist-to-Height Ratio Calculator
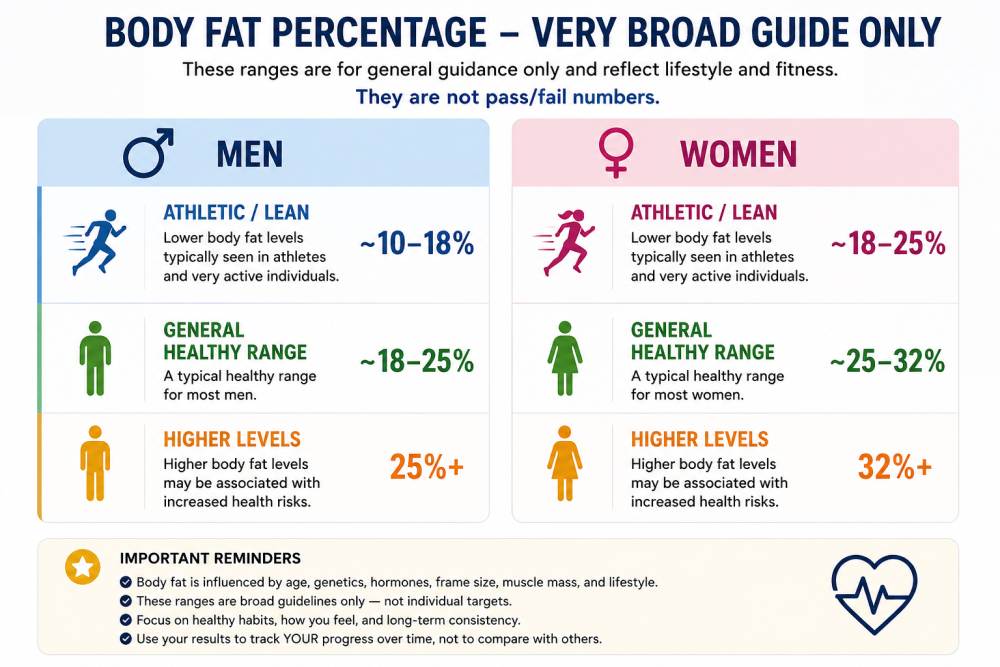
Body Fat (% and kg)
Body fat is typically expressed as total body fat in kilograms and total body fat percentage.
Body fat is essential for hormones, organ protection, energy storage, immune function and general health.
Again, body fat numbers are highly individual. Age, gender, genetics, frame size, activity levels and training history all play a role.
Muscle Mass (kg)
This reflects your estimated skeletal muscle mass.
Muscle is incredibly important for posture, strength, movement, metabolic health, ageing well and injury prevention.
Larger frames naturally hold more muscle, taller individuals generally record higher numbers, and comparisons between people are often meaningless.
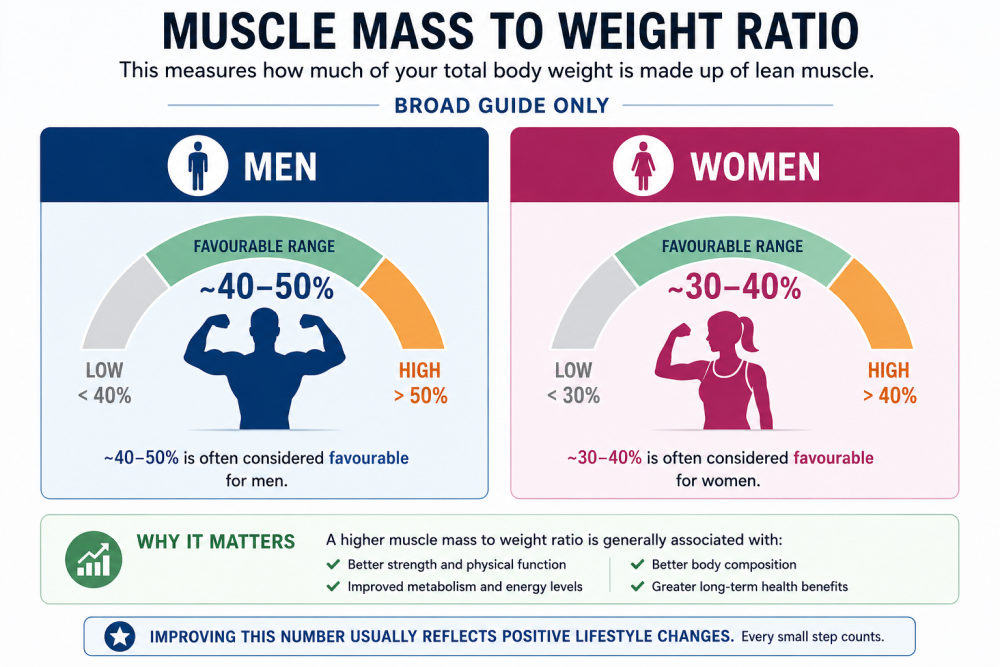
Muscle Mass to Weight Ratio (%)
This is often more useful than muscle mass alone.
It reflects how much of your total body weight is made up of lean muscle tissue.
- Higher ratios are generally favourable.
- Lower ratios may indicate low muscle relative to total weight.
Bone Mass
Bone mass reflects estimated structural bone tissue.
This becomes increasingly important with ageing, particularly for females after menopause.
Positive influences on bone health include resistance training, impact exercise, walking/running, adequate protein intake, vitamin D and calcium intake.
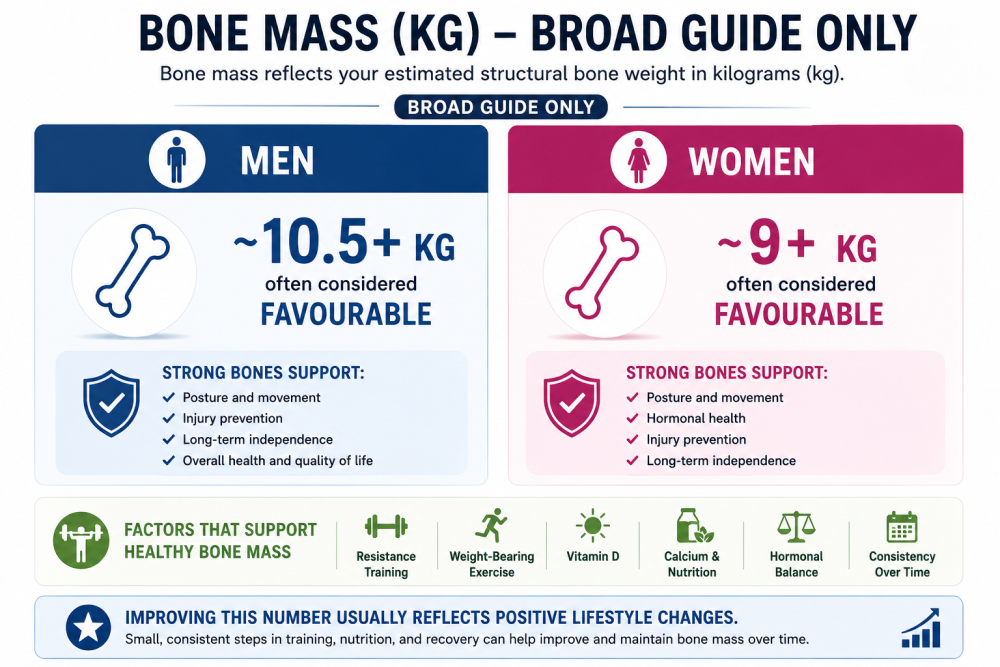
Broad guide — kg
- Men: ~10.5+ often considered favourable
- Women: ~9+ often considered favourable
Basal Metabolic Rate — BMR
This estimates how many calories your body burns at rest simply to stay alive.
Your body requires energy for breathing, circulation, brain function, organ function and recovery.
- More muscle mass generally supports a higher metabolic rate.
- Higher movement levels often support better metabolic health.
Metabolic Age
Metabolic age is a calculated estimate based on body composition, muscle mass, body fat and metabolic rate.
I tend to view metabolic age more as a motivational tool, a lifestyle “game”, and a trend marker over time.
If healthier habits improve the number — great. But don’t overthink it.
Final Thoughts
The goal of these assessments is not perfection.
The real goal is awareness, education, consistency and positive lifestyle direction.
Small sustainable improvements add up. They improve energy, movement, metabolic health and quality of life.