


-
Group results typically present with
endless energy, risk-free health and optimal weight.
#
Test
15% Group
50% Group
35% Group
1
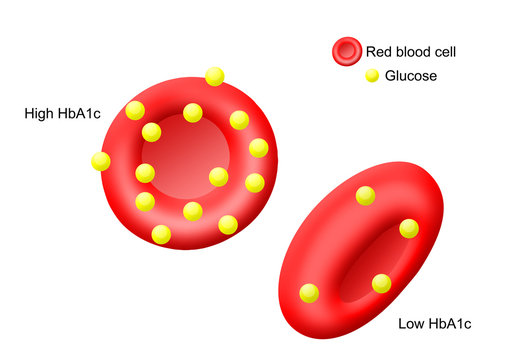
HbA1c (%) - Glucose
5.2 - 5.6
4.8 - 5.2
4.7 - 5.0
2
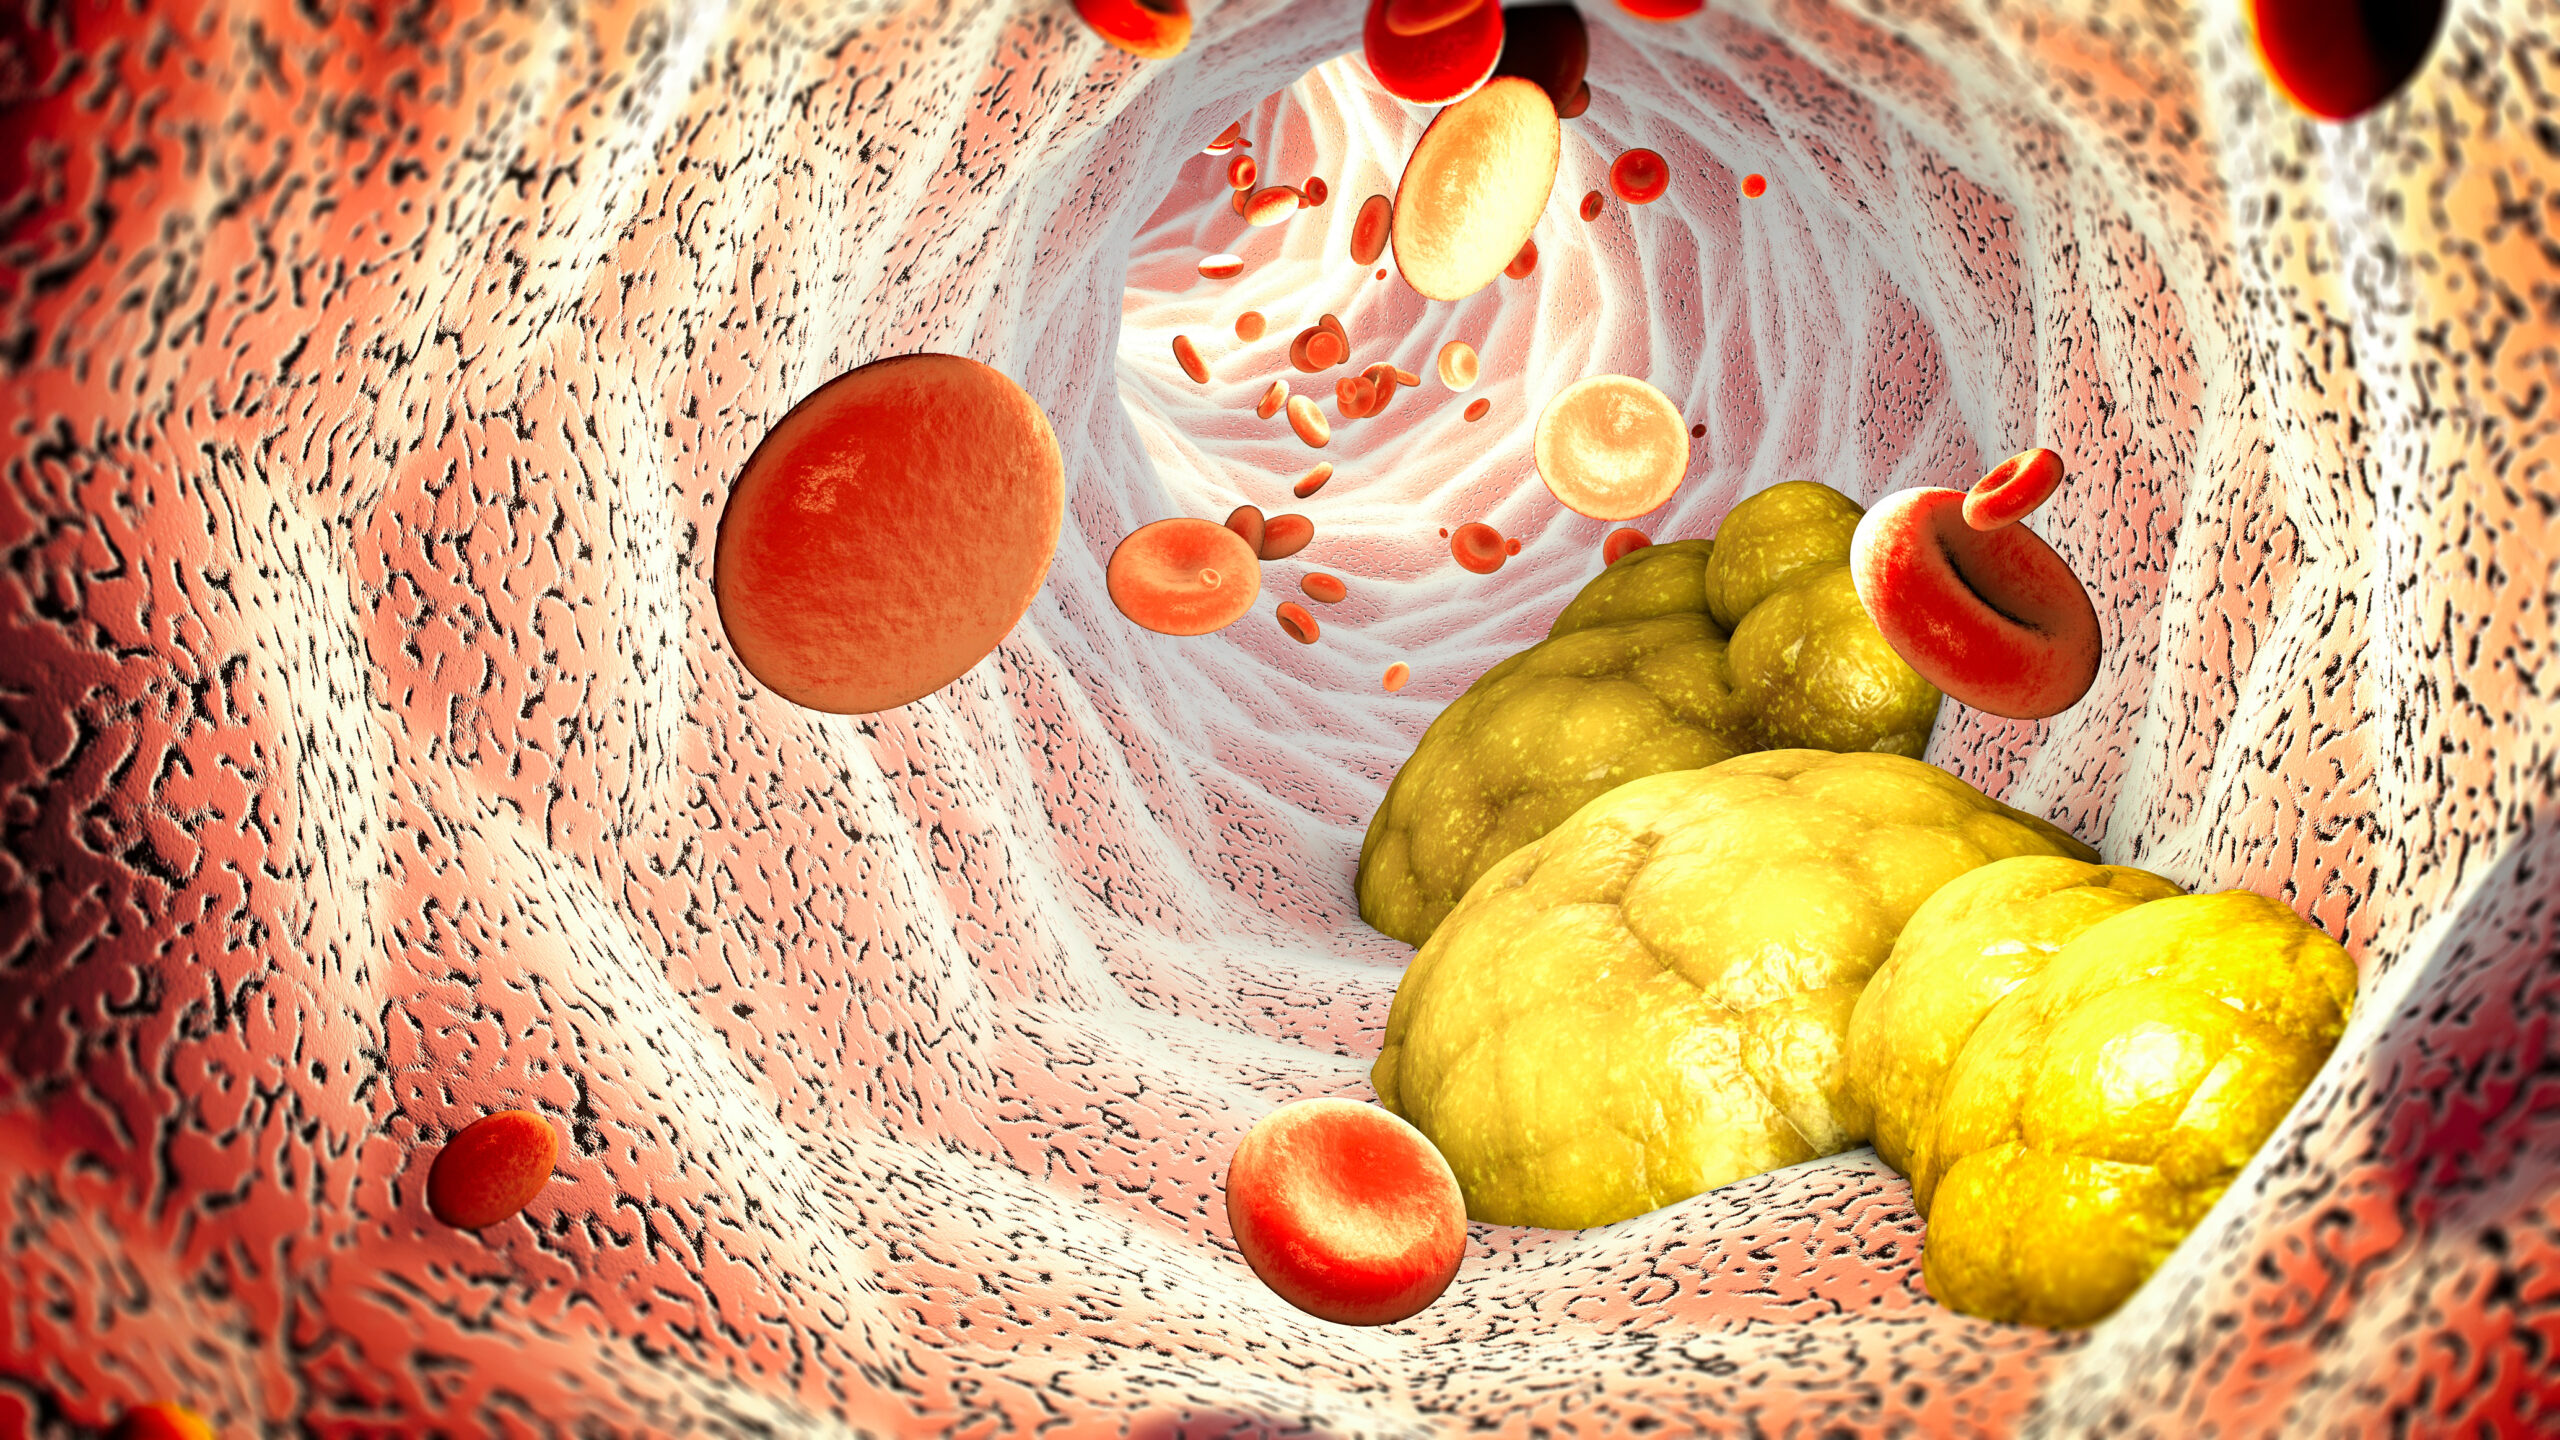
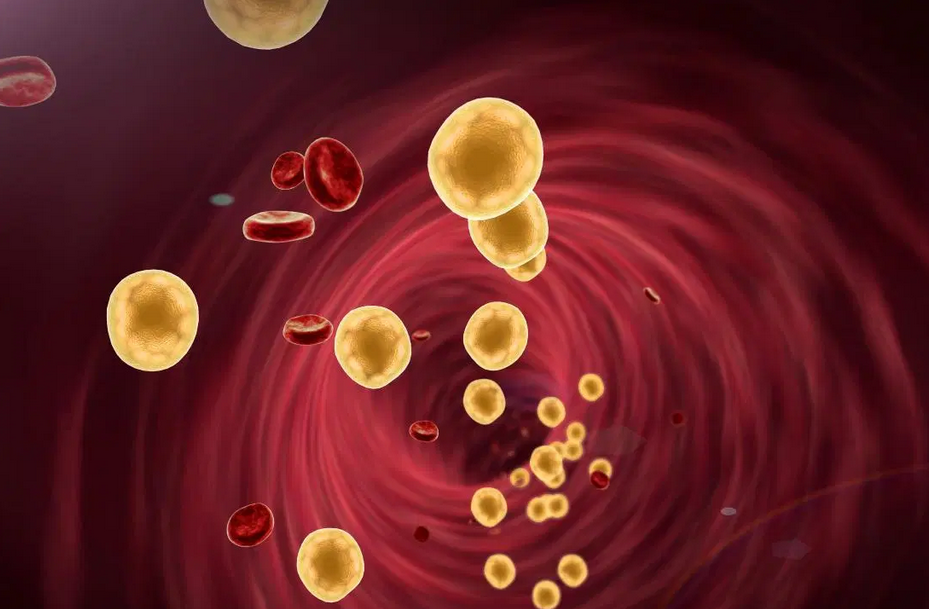
Triglycerides (mmol/L)
⇐2.0
⇐1.8
⇐1.7
3
HDL Cholesterol (mmol/L)
1.0⇒
1.1⇒
1.2⇒
4
Uric Acid (mmol/L)
⇐5.8
⇐5.8
⇐5.8
Further confirming metrics
5
Blood Pressure
110-125/ 70-85
110-125/ 70-85
110-120/ 70-80
6
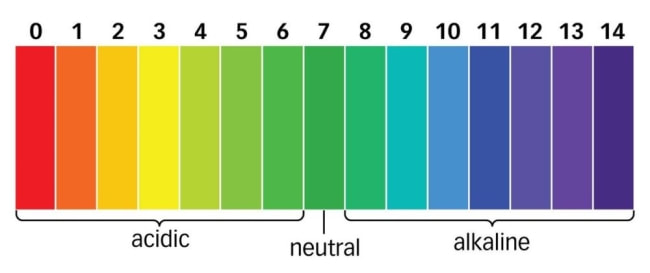
Urine pH (0-14)
7.2 - 7.4
7.2 - 7.4
7.2 - 7.4
7
Blood Ketones (mmol/L)
0.0 - 0.2
0.1 – 0.3
0.0 – 0.2
8
Resting blood lactic acid
⇐0.7
⇐0.8
⇐0.8
-


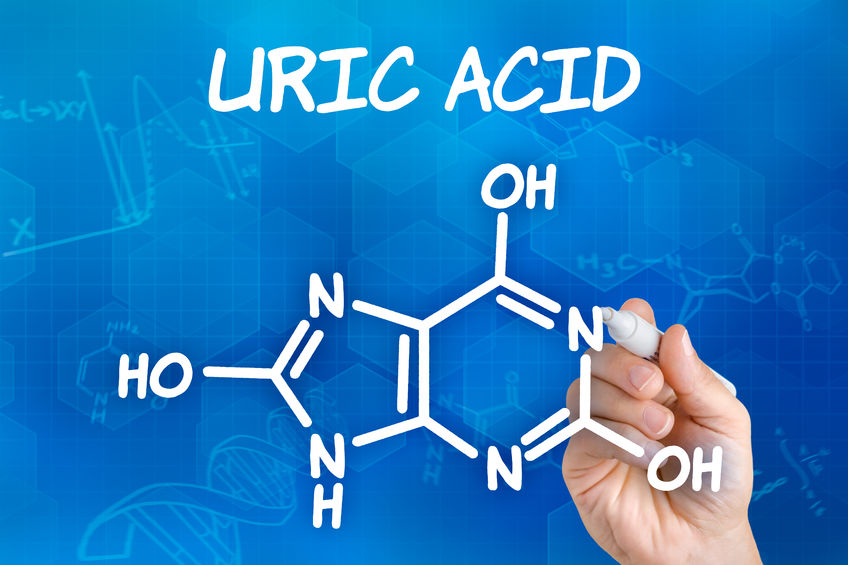
 Waste product
* Alcohol
* Dehydration
* Poor sleep
* Stress
* Purine food
* Refined sugarMeasurement of work!
* Glucose dominated metabolism
* Weight gain
* Poor aerobic health
* Stress
* lowering muscular strength
* Refined sugar consumptionMeasurement of health!
* Poor gut health balance
* UPF consumption
* Alcohol
* Stress
* Poor sleep


