
General Health & Risk Assessment
Short, practical markers that help identify how well the body is functioning — and more importantly — where risk may be quietly building before symptoms become obvious.
Blood Pressure
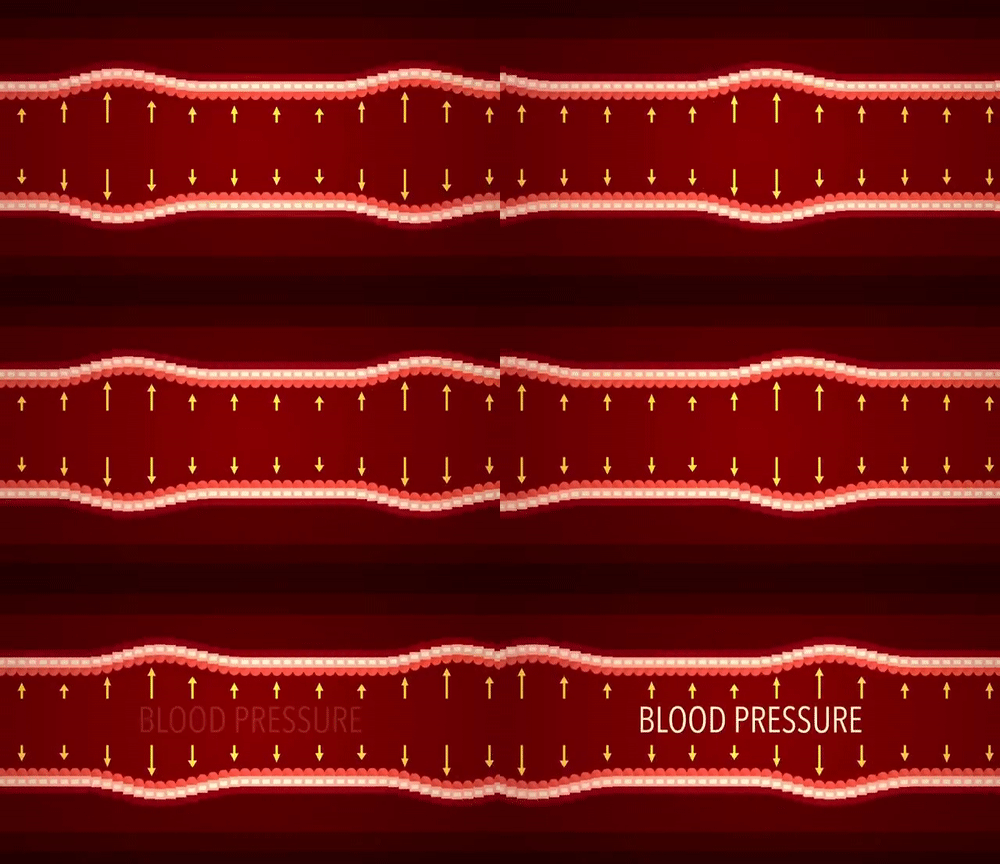
Blood pressure reflects how hard the heart must work to push blood around the body. Chronically elevated readings increase the risk of heart disease, stroke, kidney disease and vascular damage. Lifestyle, stress, sleep, body fat, alcohol, inactivity and fitness all heavily influence results.
| Classification | Reading |
|---|---|
| Good | ~110–120 / 70–80 |
| Normal | ~121–129 / 81–84 |
| Worth Reviewing | ≥130/85 consistently |
| Higher Risk | ≥140/90 |

EKG (via Kardia) – Normal Sinus Rhythm & Resting Heart Rate
A simple EKG helps screen heart rhythm quality and detect irregularities like atrial fibrillation. Resting heart rate also provides insight into fitness, recovery, nervous system load and cardiovascular efficiency. Lower isn’t always better — context matters.
| Classification | Heart Rate |
|---|---|
| Fit / Efficient | ~45–60 BPM |
| Normal | ~60–75 BPM |
| Worth Reviewing | >80 consistently |
| Possible Fatigue / Stress / Illness | Elevated above personal norm |
Lung Capacity – FVC (Forced Vital Capacity)
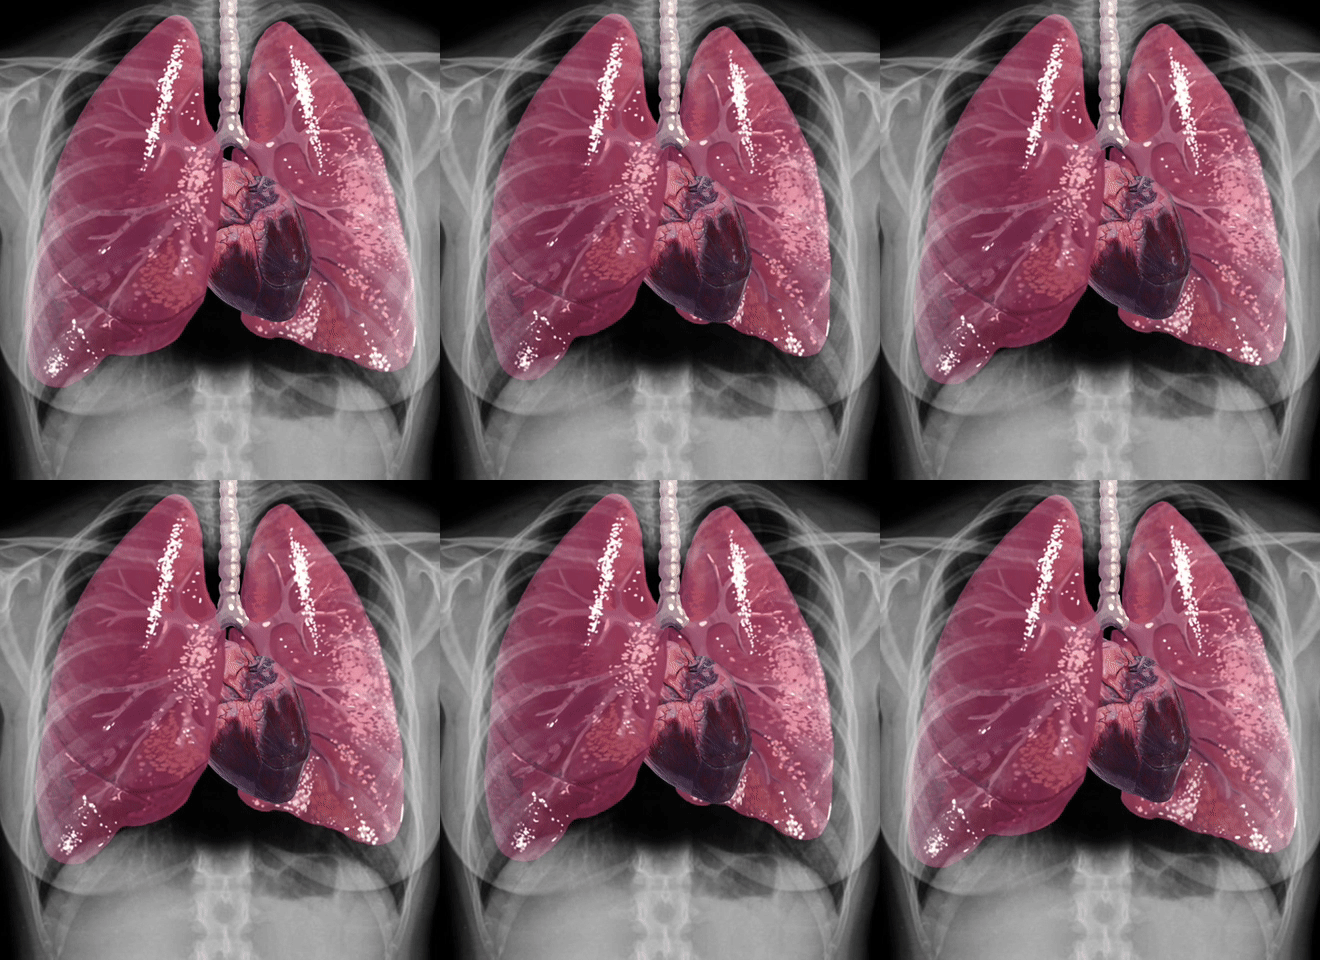
FVC measures how much air the lungs can forcefully exhale after a deep breath. It reflects respiratory strength, lung health, posture, fitness and sometimes body composition. Lower scores may relate to inactivity, asthma, excess body fat, smoking history or respiratory restriction.
| Group | Good | Normal | Worth Reviewing |
|---|---|---|---|
| Men | 4.5–6.0+ L | 3.8–4.5 L | <3.5 L |
| Women | 3.5–4.8+ L | 3.0–3.5 L | <2.8 L |
HbA1c
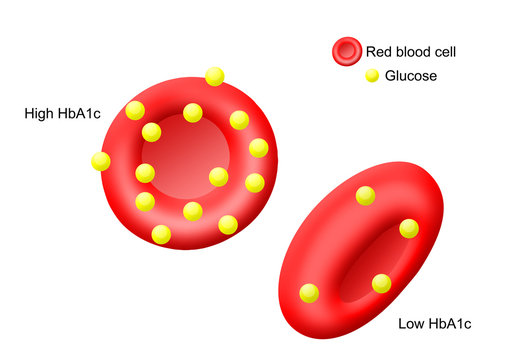
HbA1c estimates average blood glucose levels over roughly 8–12 weeks. It is one of the strongest long-term markers for metabolic health, carbohydrate tolerance and diabetes risk. Elevated levels are commonly linked to excess processed food intake, inactivity, poor sleep and increasing abdominal fat.
| Classification | Result |
|---|---|
| Excellent Metabolic Control | ~4.8–5.2 |
| Normal | 5.3–5.6 |
| Worth Reviewing | 5.7–6.4 |
| Diabetes Range | ≥6.5 |
Triglycerides
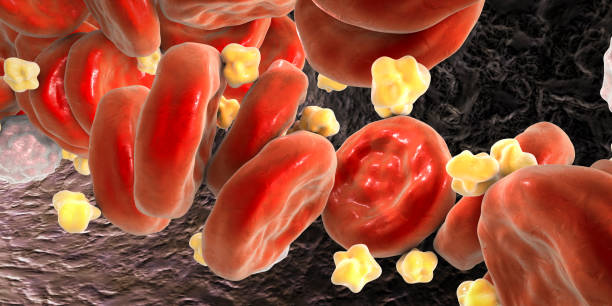
Triglycerides are blood fats heavily influenced by excess calories, sugar intake, alcohol, poor sleep and inactivity. Elevated triglycerides are strongly linked to metabolic syndrome, fatty liver and cardiovascular disease risk.
| Classification | Result |
|---|---|
| Excellent | <1.0 |
| Normal | 1.0–1.7 |
| Worth Reviewing | 1.8–2.5 |
| Higher Risk | >2.5 |
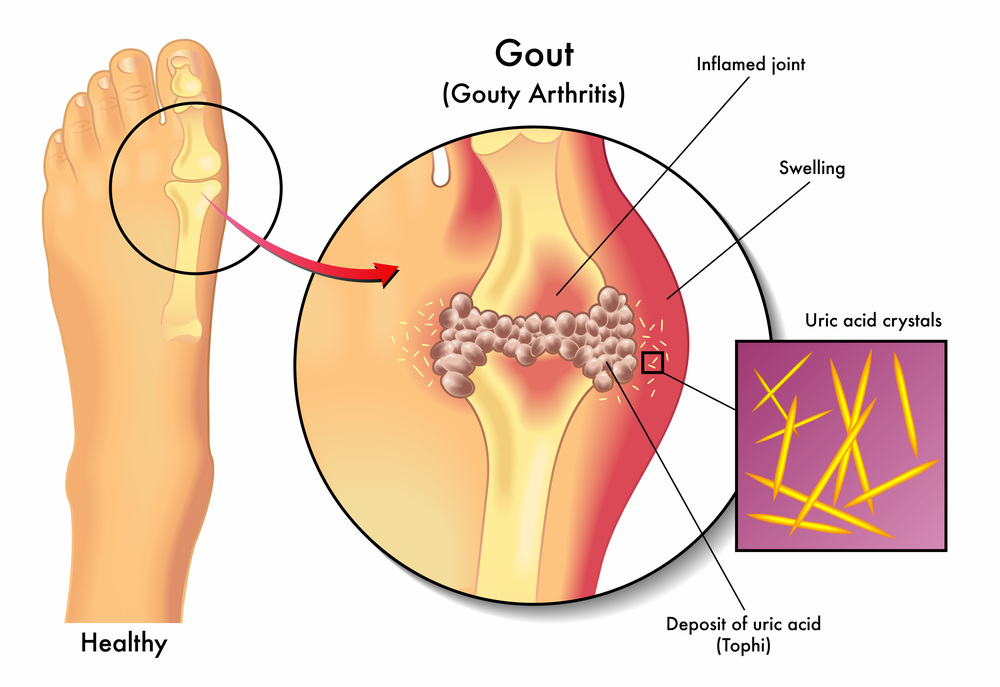
Uric Acid
Uric acid reflects how the body manages waste products from metabolism and certain foods. Elevated levels are linked to gout, kidney stress, dehydration, metabolic dysfunction, excess alcohol intake and poor dietary balance. It often rises alongside increasing metabolic ill-health.
| Group | Good | Normal | Worth Reviewing |
|---|---|---|---|
| Men | 4.0–6.0 | 6.0–7.0 | >7.0 |
| Women | 3.5–5.5 | 5.5–6.5 | >6.5 |
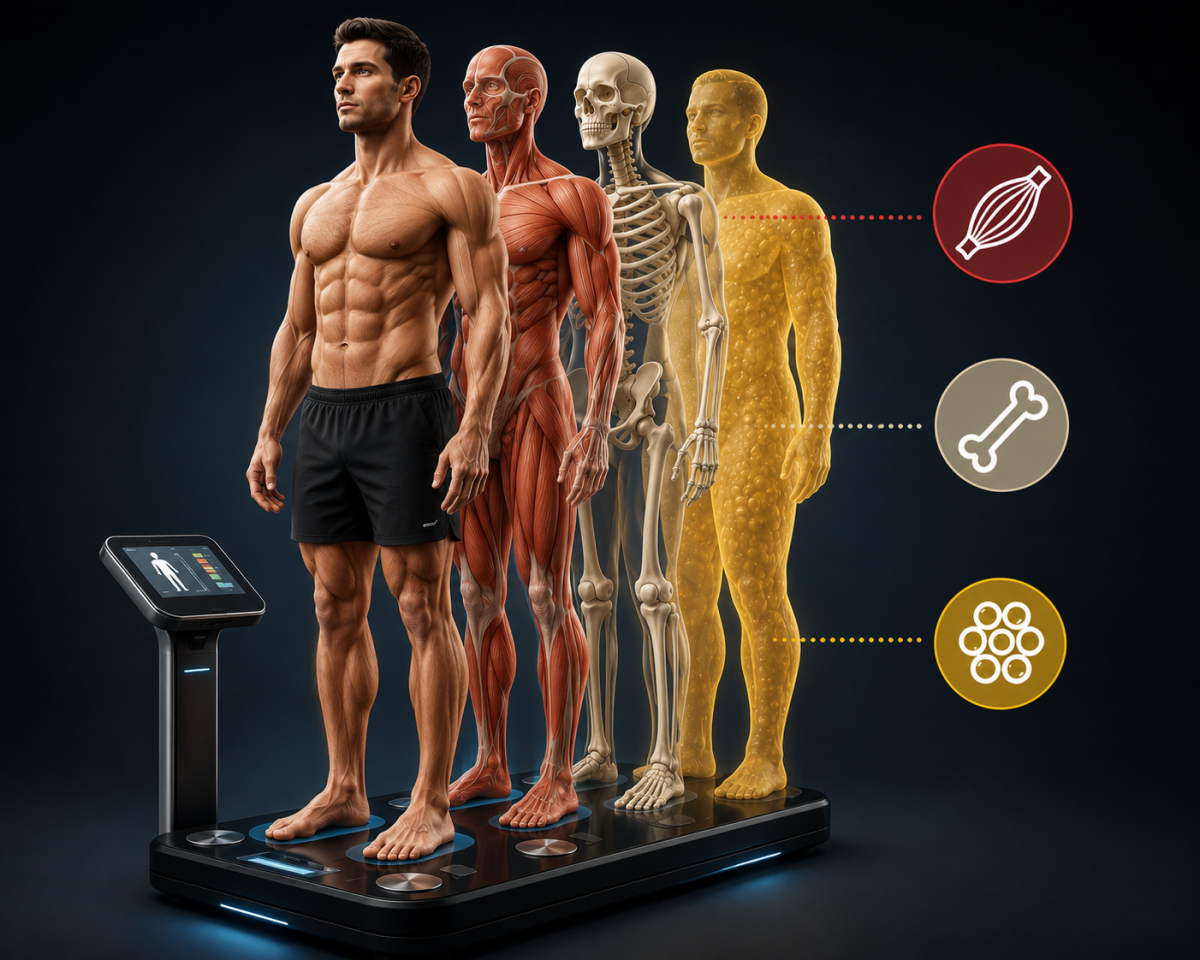
Muscle Mass to Weight Ratio
This reflects how much of total body weight is functional lean muscle tissue. Higher ratios are strongly associated with better metabolism, strength, insulin sensitivity, mobility and long-term health. Low muscle ratios often sit alongside fatigue, weight gain and declining physical resilience.
| Group | Strong / Healthy | Normal | Worth Reviewing |
|---|---|---|---|
| Men | >42% | 38–42% | <38% |
| Women | >36% | 32–36% | <32% |
Bone Mass
Bone mass provides insight into skeletal strength and long-term structural resilience. Resistance training, impact exercise, hormones, nutrition and aging all influence bone quality. Declining bone mass increases fracture and osteoporosis risk — particularly with aging and inactivity.
| Group | Healthy | Worth Reviewing |
|---|---|---|
| Men | ~10.0–12.0 kg | Lower than expected for frame size/age |
| Women | ~8–10 kg | Progressive decline over time |
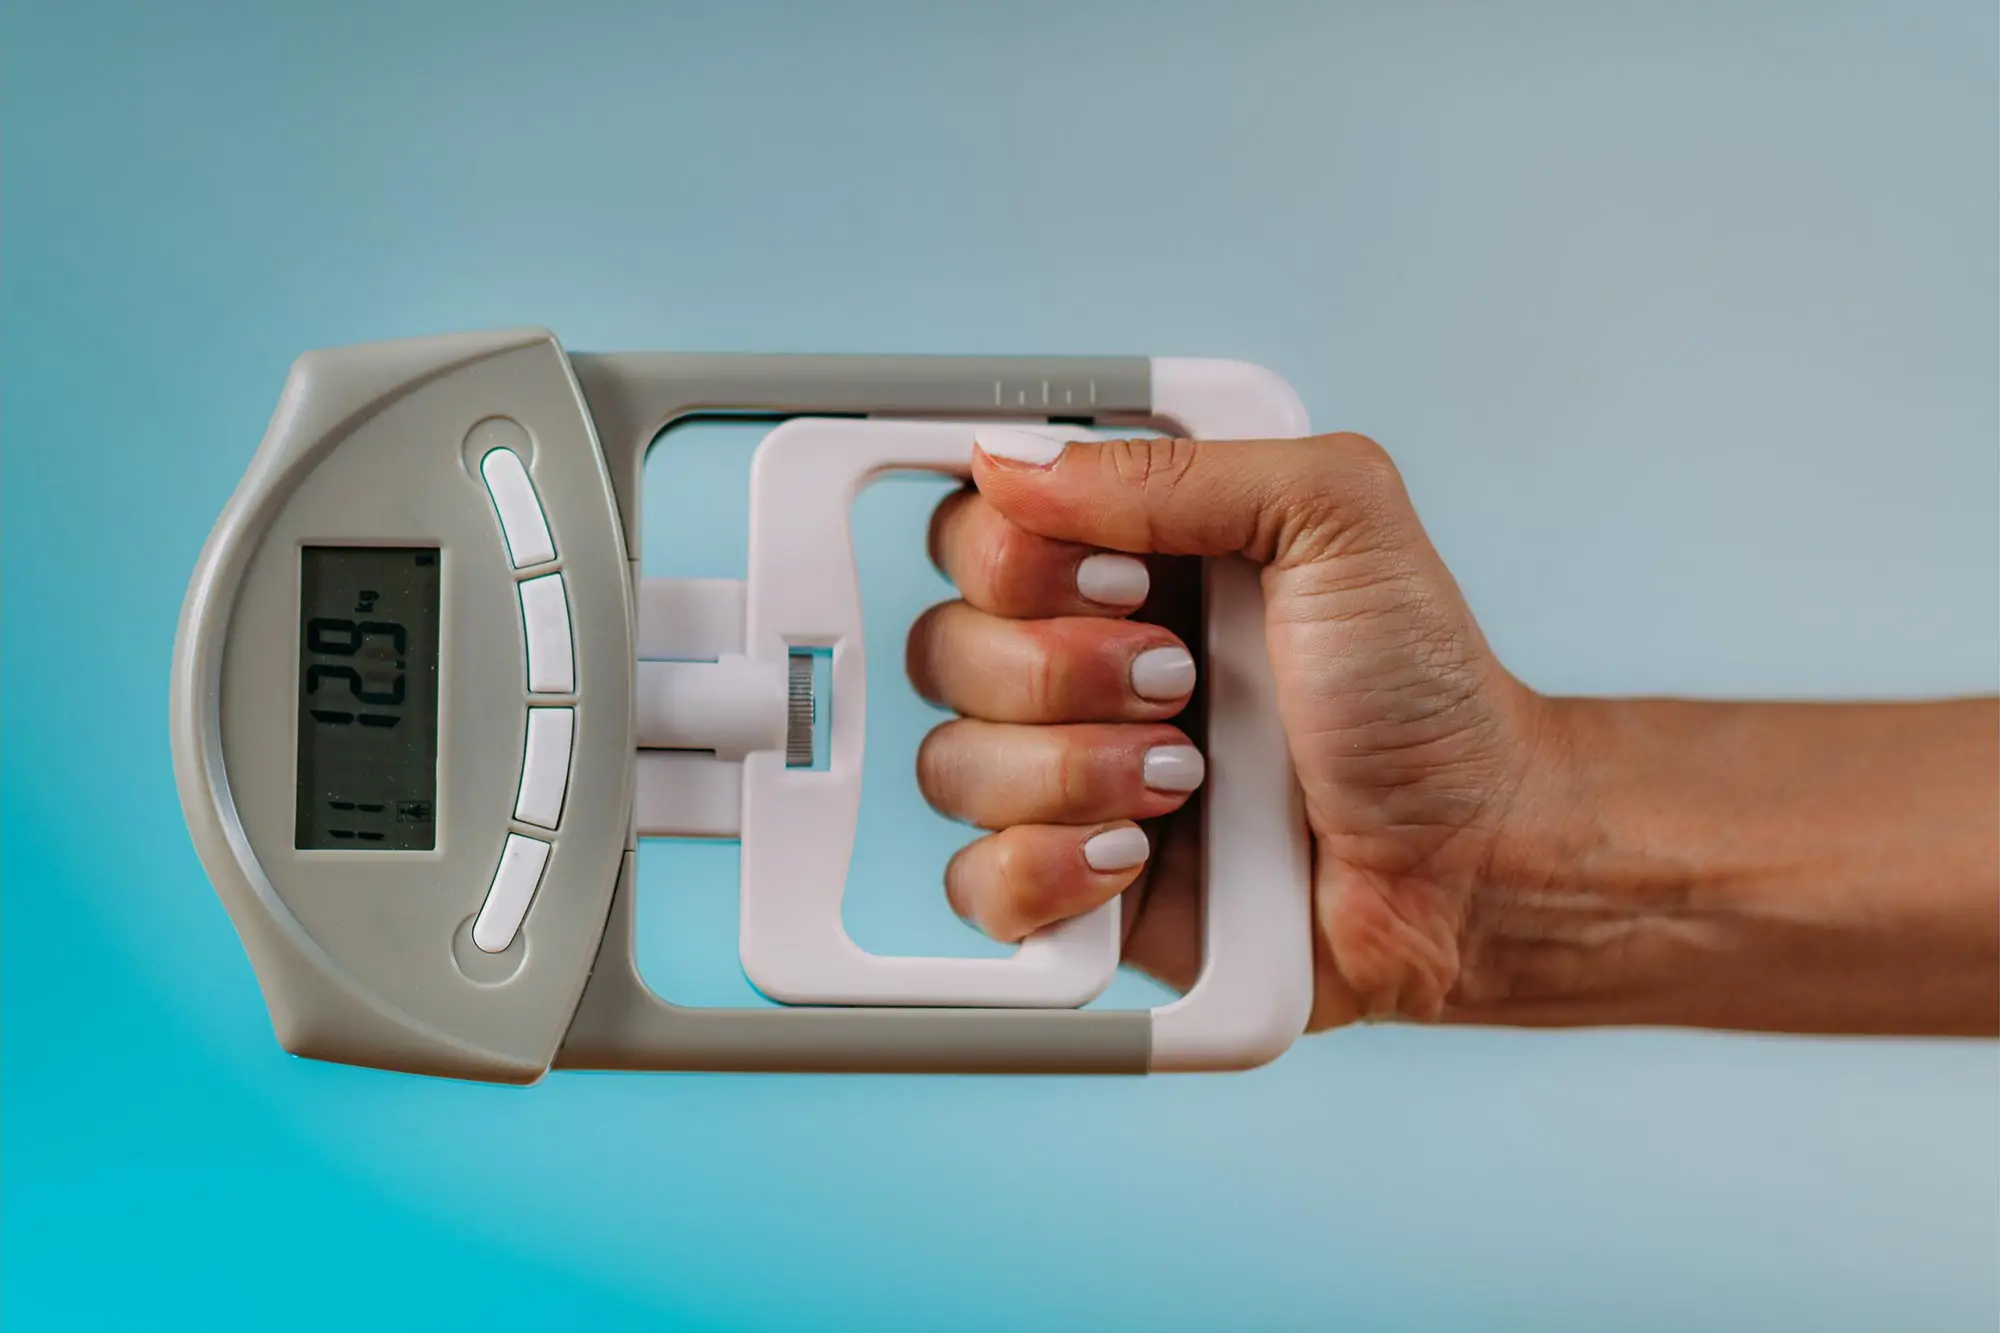
Grip Strength
Grip strength is one of the simplest and surprisingly powerful markers of overall functional strength, nervous system health and aging quality. Lower scores are associated with increased frailty, poorer mobility and reduced long-term health outcomes.
| Group | Strong | Normal | Worth Reviewing |
|---|---|---|---|
| Men | 45–60+ kg | 35–45 kg | <35 kg |
| Women | 28–40+ kg | 20–28 kg | <20 kg |
Overall Philosophy
This style of testing is not about chasing perfection.
It’s about identifying early trends before they become disease, dysfunction or decline.
The body whispers long before it screams.
These numbers often tell the story early.