
Athletic Potential & Recovery Assessment
These markers are less about disease risk and more about performance capacity, recovery quality, structural durability and physiological efficiency.
Athletically inclined individuals often sit in a very different space to the general population.
Importantly, context matters enormously in athletic testing.
The goal is not simply “high” or “low” — but whether the athlete is functioning efficiently, recovering appropriately and adapting positively to training demand.
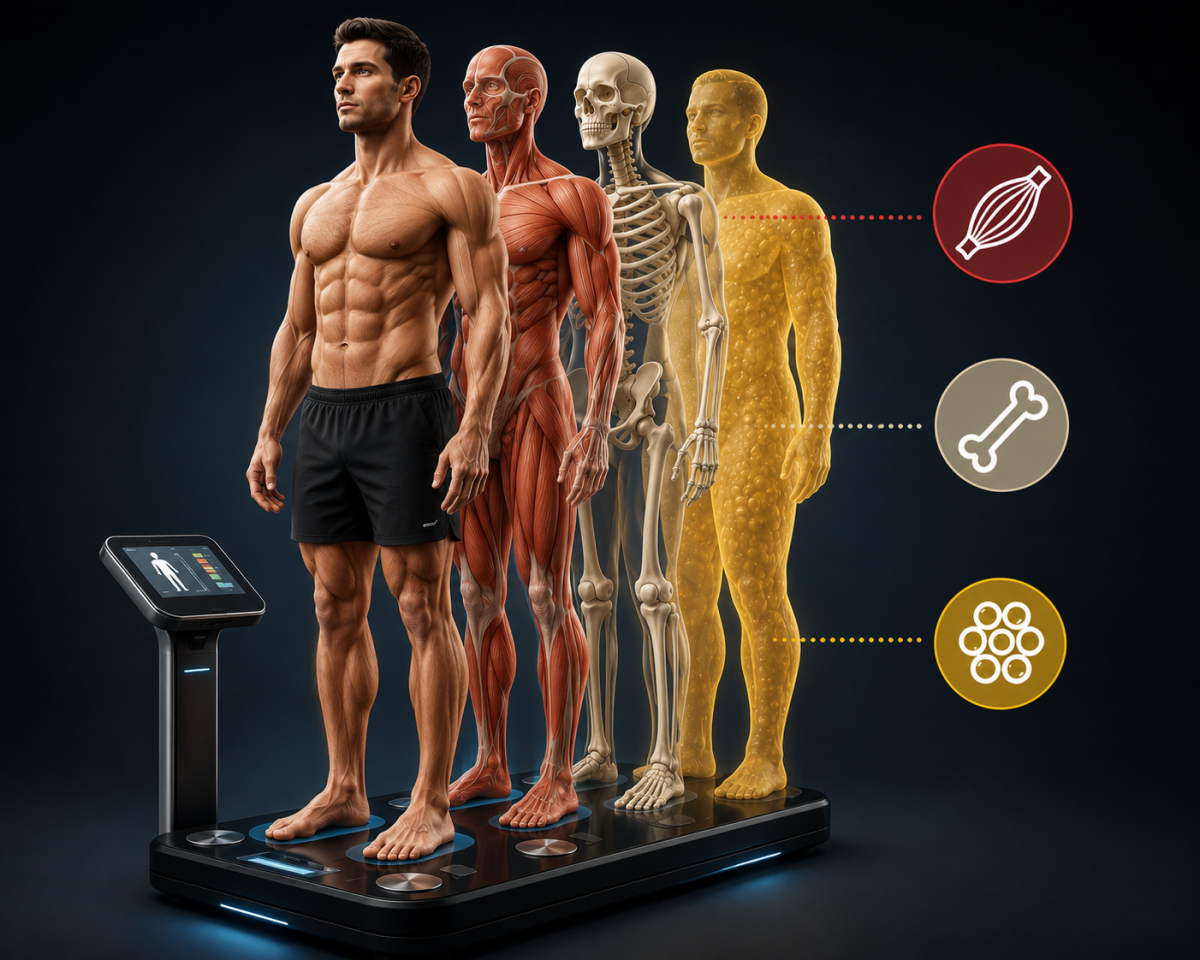
Muscle to Weight Ratio
Muscle to weight ratio reflects how much of total body weight is functional lean tissue. In endurance and hybrid athletes, this marker helps identify power-to-weight efficiency, metabolic resilience and structural durability.
Higher is not always better — excessive muscle mass may compromise endurance efficiency — but low muscle ratios often reflect reduced strength, injury risk and poorer long-term athletic resilience.
| Classification | Result |
|---|---|
| Elite Athletic | >48% |
| High Performance | 44–48% |
| Good Athletic | 40–44% |
| Worth Reviewing | <40% |
| Classification | Result |
|---|---|
| Elite Athletic | >42% |
| High Performance | 38–42% |
| Good Athletic | 34–38% |
| Worth Reviewing | <34% |
Athletic Perspective
- High muscle quality
- Lower non-functional mass
- Strong posterior chain development
- Efficient power-to-weight ratio

Body Fat %
Body fat percentage strongly influences endurance economy, heat tolerance, movement efficiency and metabolic flexibility.
Too high generally compromises performance. Too low may compromise hormones, recovery, immunity and long-term durability.
| Classification | Result |
|---|---|
| Elite Endurance Lean | 6–10% |
| High Performance | 10–14% |
| Athletic Healthy | 14–18% |
| Worth Reviewing | >20% |
| Classification | Result |
|---|---|
| Elite Endurance Lean | 14–18% |
| High Performance | 18–22% |
| Athletic Healthy | 22–26% |
| Worth Reviewing | >28% |
Athletic Perspective
- Well-fuelled
- Strong
- Recovered
- Hormonal systems functioning well
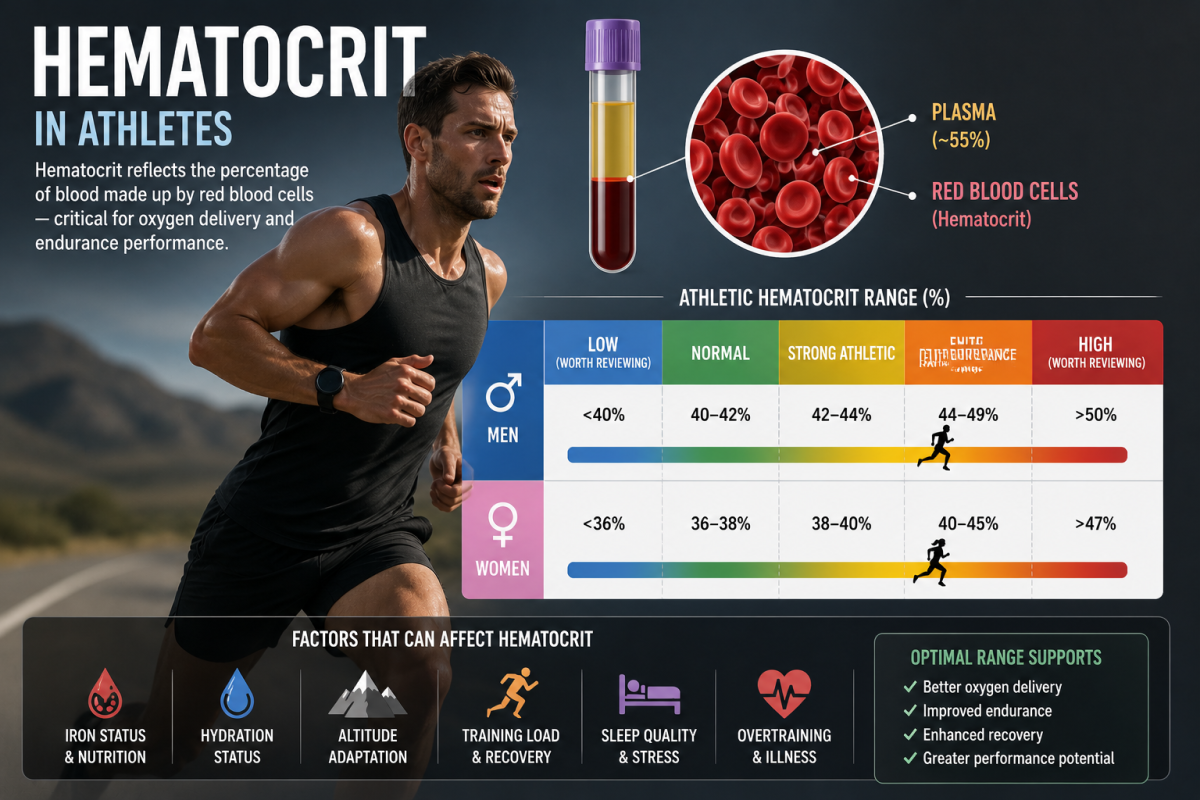
Hematocrit (Hct)
Hematocrit reflects the percentage of blood made up by red blood cells. It is strongly linked to oxygen-carrying capacity, endurance performance and hydration status.
Higher hematocrit often improves endurance potential — up to a point.
| Classification | Result |
|---|---|
| Elite Endurance Range | 44–49% |
| Strong Athletic | 42–44% |
| Normal | 40–42% |
| Worth Reviewing | <40% or >50% |
| Classification | Result |
|---|---|
| Elite Endurance Range | 40–45% |
| Strong Athletic | 38–40% |
| Normal | 36–38% |
| Worth Reviewing | <36% or >47% |
Athletic Perspective
- Iron deficiency
- Heavy training load
- Poor recovery
- Altitude adaptation
- Hydration status
Hemoglobin (Hb)
Hemoglobin is one of the most important endurance markers available. It reflects the blood’s oxygen transport capacity and strongly influences aerobic performance, recovery and fatigue resistance.
Even mildly reduced Hb can significantly impair endurance output and recovery quality.
| Classification | Result |
|---|---|
| Elite Endurance | 15.0–17.0 |
| Strong Athletic | 14.0–15.0 |
| Normal | 13.5–14.0 |
| Worth Reviewing | <13.5 |
| Classification | Result |
|---|---|
| Elite Endurance | 13.5–15.0 |
| Strong Athletic | 12.8–13.5 |
| Normal | 12.0–12.8 |
| Worth Reviewing | <12.0 |
Athletic Perspective
- Flat training sessions
- Elevated heart rate at normal pace
- Heavy legs
- Reduced motivation
- Difficulty holding endurance pace
Resting EKG – via the Kardia Unit
A resting EKG provides insight into heart rhythm quality and basic cardiac electrical function. In athletes, lower resting heart rates are common and often reflect positive cardiovascular adaptation.
| Classification | Result |
|---|---|
| Elite Endurance Adaptation | 38–48 BPM |
| Highly Trained | 48–58 BPM |
| Athletic Normal | 58–68 BPM |
| Worth Reviewing | >75 consistently or unusual rhythm changes |
Athletic Perspective
- Increased stroke volume
- Improved aerobic adaptation
- Efficient parasympathetic recovery
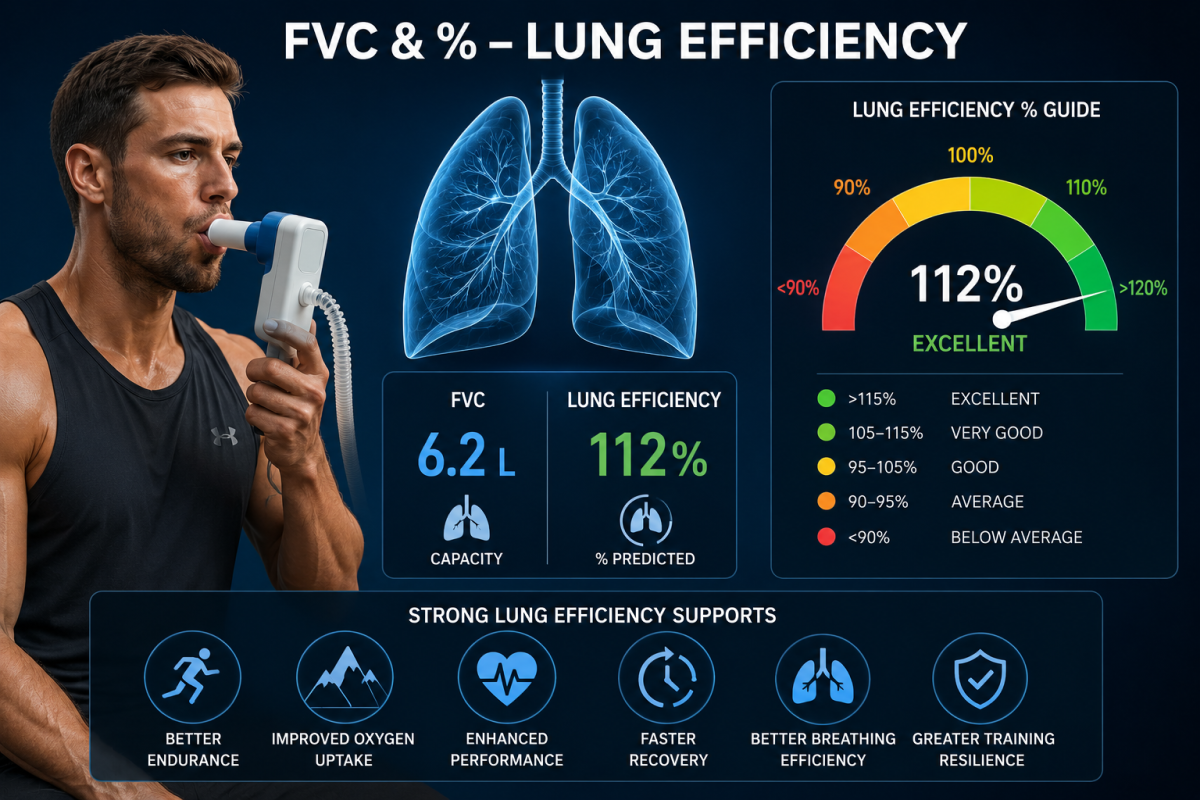
FVC & % – Lung Efficiency
Forced Vital Capacity reflects respiratory strength, lung size and breathing efficiency. Athletes with strong aerobic conditioning commonly demonstrate elevated FVC values relative to the general population.
| Classification | Result |
|---|---|
| Elite Endurance | 5.5–7.0+ L |
| Strong Athletic | 4.8–5.5 L |
| Athletic Normal | 4.2–4.8 L |
| Worth Reviewing | <4.0 L |
| Classification | Result |
|---|---|
| Elite Endurance | 4.5–6.0+ L |
| Strong Athletic | 3.8–4.5 L |
| Athletic Normal | 3.2–3.8 L |
| Worth Reviewing | <3.0 L |
| Classification | Result |
|---|---|
| Exceptional | >115% |
| Excellent | 105–115% |
| Strong | 95–105% |
| Worth Reviewing | <90% |
Athletic Perspective
- Respiratory restriction
- Poor posture
- Asthma
- Fatigue accumulation
- Poor breathing mechanics
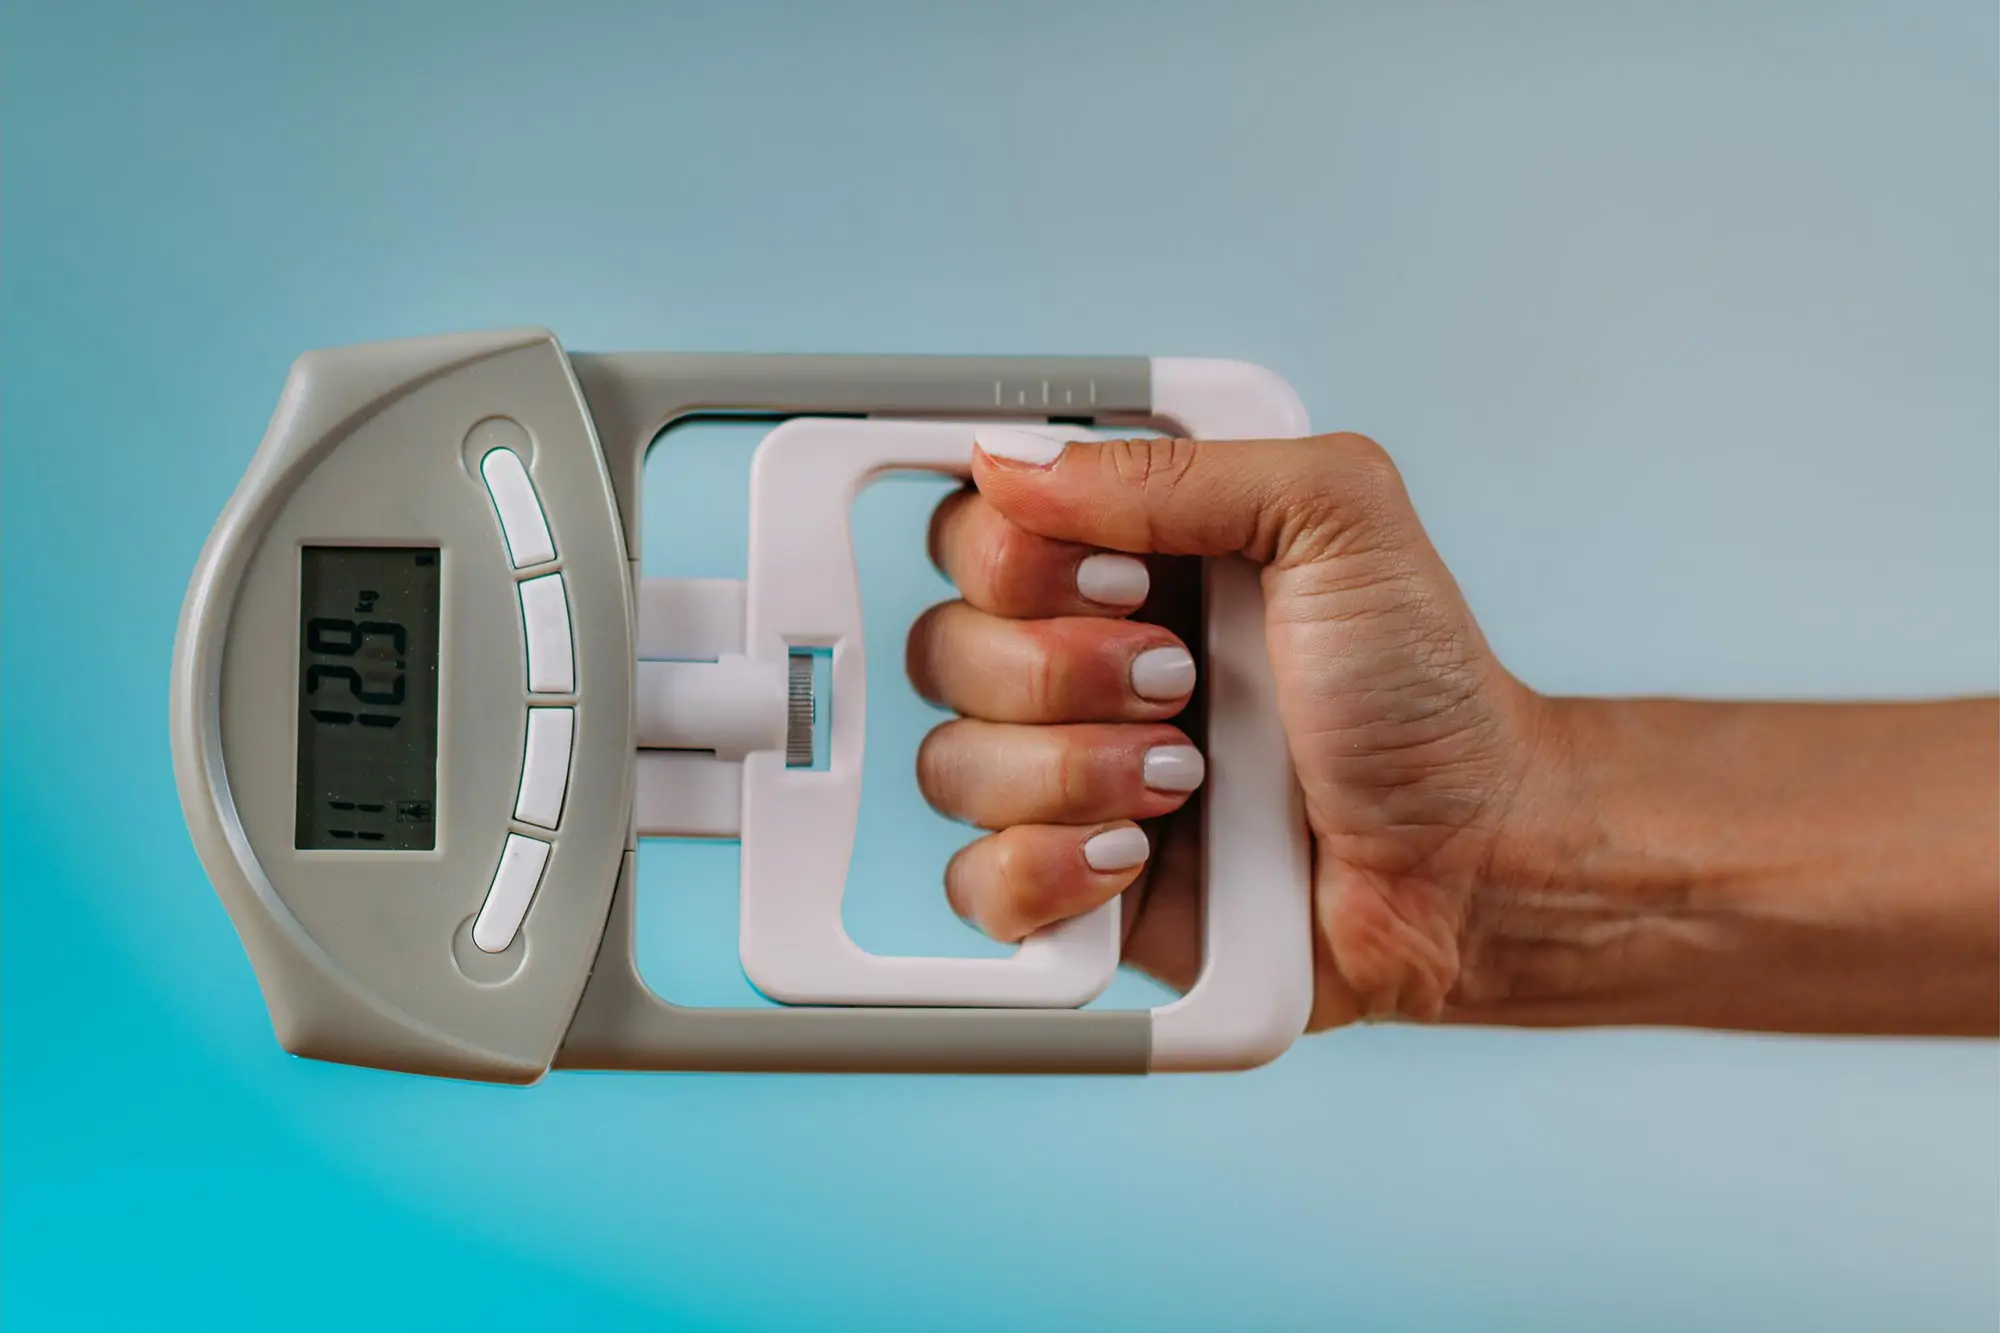
Grip Strength
Grip strength is one of the simplest but most valuable athletic markers available. It strongly reflects nervous system readiness, structural strength and recovery state.
| Classification | Result |
|---|---|
| Elite Strength | 60–75+ kg |
| Strong Athletic | 50–60 kg |
| Athletic Normal | 40–50 kg |
| Worth Reviewing | <40 kg |
| Classification | Result |
|---|---|
| Elite Strength | 40–55+ kg |
| Strong Athletic | 32–40 kg |
| Athletic Normal | 24–32 kg |
| Worth Reviewing | <24 kg |
Athletic Perspective
- Nervous system fatigue
- Under-recovery
- Illness onset
- Excessive training load
- Reduced neuromuscular freshness
Overall Athletic Philosophy
High performance is not simply about pushing harder.
The best athletes generally display:
- Strong recovery capacity
- Efficient oxygen delivery
- Stable heart rhythm
- High movement economy
- Strong nervous system resilience
- Appropriate muscle-to-weight balance
- Excellent metabolic flexibility
The numbers should support performance — not control identity.
Good testing should help:
- Guide training load
- Improve recovery decisions
- Identify fatigue trends early
- Reduce injury risk
- Improve long-term consistency
Because ultimately:
Consistency beats intensity over time.