
Metabolic Health & Weight Management Assessment
These markers help explain not just body weight — but why the body may currently be storing fat, struggling with appetite control, low energy, poor recovery or reduced metabolic flexibility.
Importantly, these numbers are not about judgement.
They are about understanding how the body is currently responding to modern lifestyle, food intake, stress, sleep and activity patterns.

Weight to Height Ratio
Body weight alone tells very little. Weight relative to height gives a far better snapshot of metabolic strain, joint loading, cardiovascular demand and likely body composition trends. Excess body weight — particularly around the abdomen — strongly increases insulin resistance, inflammation and metabolic syndrome risk.
Importantly, many people can improve health markers significantly before major weight loss even occurs.
| Men & Women Classification | Result |
|---|---|
| Lean / Lower Risk | ~20–24 |
| Mildly Elevated | 25–29 |
| Worth Reviewing | 30–34 |
| Higher Metabolic Risk | 35+ |
Important Note
Muscular or athletic individuals may score higher without carrying excessive body fat. Context always matters.

Muscle to Weight Ratio
This is one of the most important metabolic markers in long-term weight management. Muscle tissue is metabolically active — it helps regulate blood glucose, improve insulin sensitivity and increase resting energy expenditure.
Low muscle ratios commonly sit alongside fatigue, reduced metabolism, easier fat gain and poorer glucose control. In simple terms: the more quality muscle you carry, the easier the body generally manages fuel.
| Classification | Result |
|---|---|
| Strong Metabolic Profile | >42% |
| Normal | 38–42% |
| Worth Reviewing | <38% |
| Classification | Result |
|---|---|
| Strong Metabolic Profile | >36% |
| Normal | 32–36% |
| Worth Reviewing | <32% |
Metabolic Perspective
Many people trying to lose weight focus only on “losing kilos.”
Often the real goal should be improving body composition — reducing fat while preserving or increasing muscle.
HbA1c
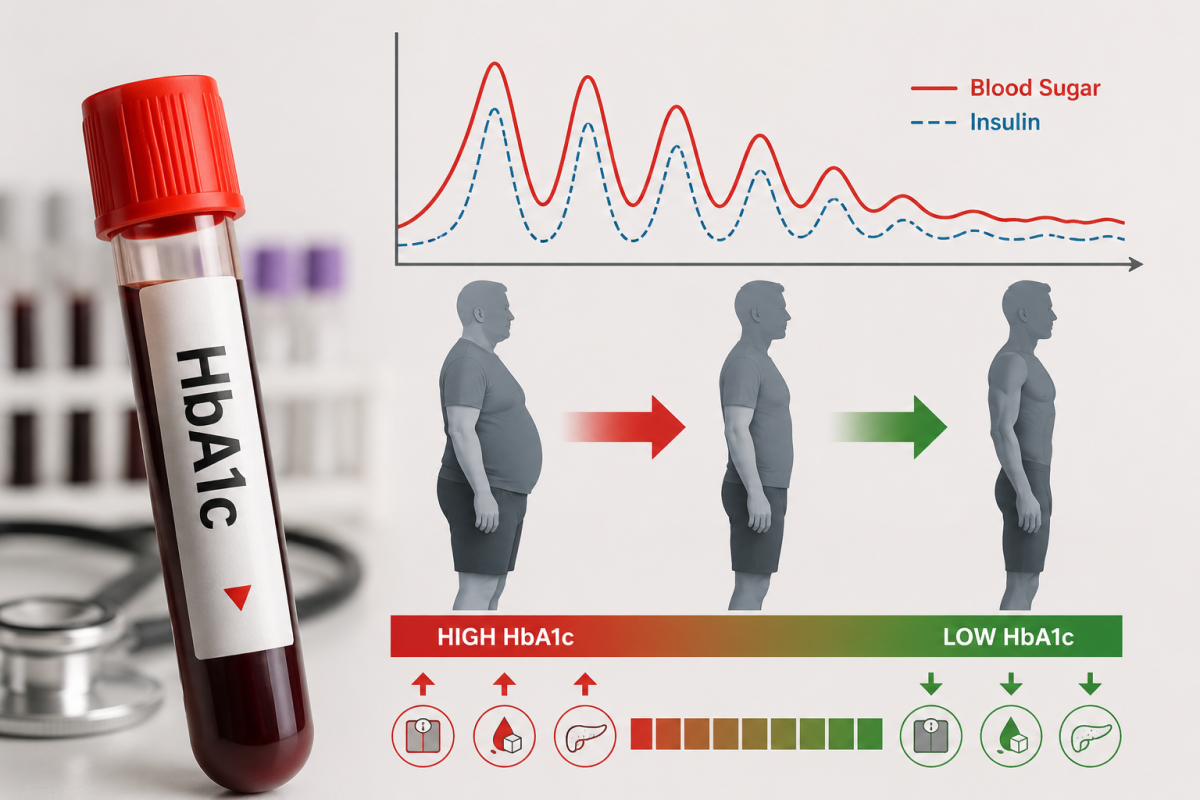
HbA1c estimates average blood glucose levels over the previous 8–12 weeks. It is one of the strongest long-term indicators of carbohydrate tolerance, insulin demand and metabolic health.
When HbA1c rises, it commonly suggests the body is struggling to manage blood glucose efficiently. This often links with increased hunger, cravings, energy crashes, abdominal fat storage and difficulty losing weight.
For many overweight individuals, HbA1c starts elevated while ketones remain very low — a sign the body is heavily dependent on glucose and less efficient at accessing stored body fat as fuel.
As metabolic health improves, HbA1c commonly lowers while ketones rise modestly — often reflecting improved fat utilisation and better metabolic flexibility.
| Classification | Result |
|---|---|
| Excellent Metabolic Control | 4.8–5.2 |
| Normal | 5.3–5.6 |
| Worth Reviewing | 5.7–6.4 |
| Diabetes Range | ≥6.5 |
Metabolic Perspective
Lower HbA1c generally reflects:
- Better blood glucose stability
- Reduced insulin demand
- Improved appetite regulation
- Better fat-burning potential
- Lower metabolic disease risk
Blood Ketones
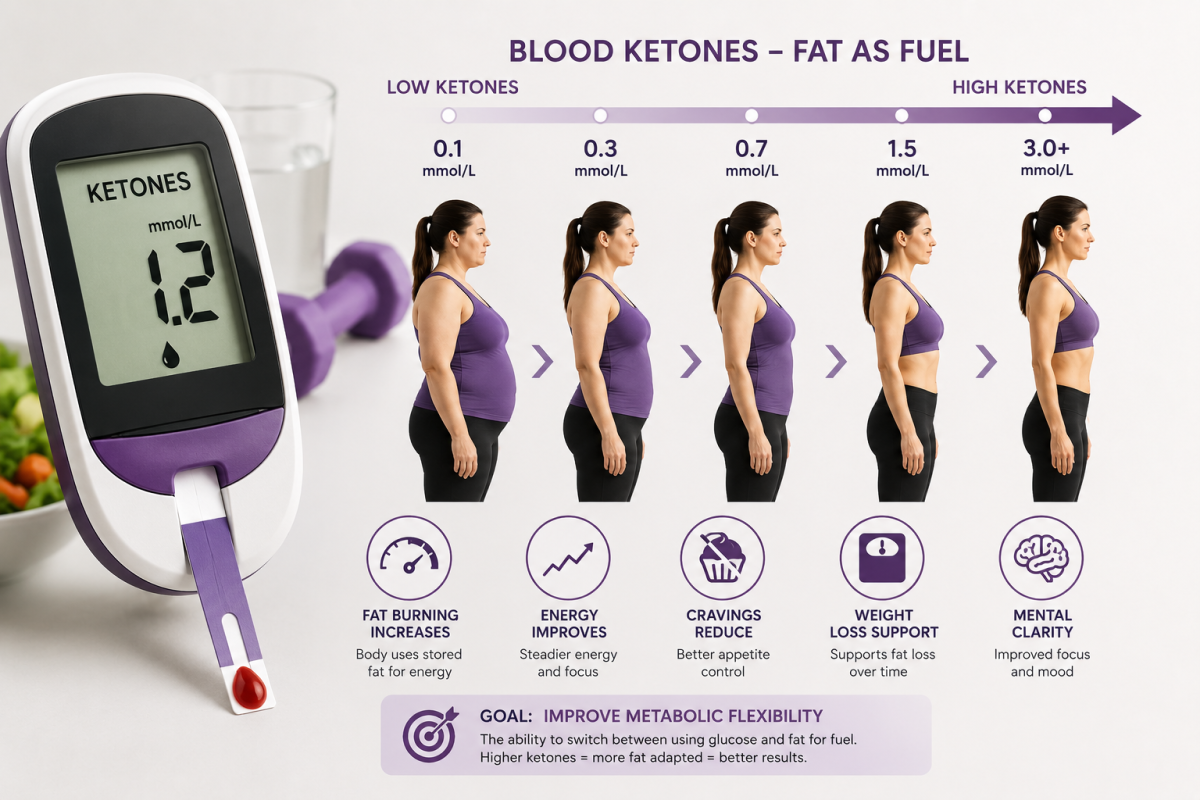
Blood ketones reflect the body’s ability to utilise fat as a fuel source. They commonly rise when carbohydrate intake lowers, fasting periods extend, exercise improves metabolic flexibility or body composition begins improving.
Many overweight individuals initially present with:
- Higher HbA1c
- Very low ketones (~0.0–0.2)
This commonly reflects a body heavily reliant on glucose rather than efficiently accessing stored fat.
As nutrition quality, meal timing and activity improve, ketones often rise modestly — which can be a very positive sign of improving metabolic flexibility.
Higher is not always “better.” Extreme ketone levels are not the goal. The aim is flexibility — the ability to efficiently use both glucose and fat as fuel when appropriate.
| Classification | Result |
|---|---|
| Very Low Fat Utilisation | 0.0–0.2 |
| Mild Nutritional Ketosis | 0.3–0.8 |
| Strong Fat Utilisation | 0.8–1.5 |
| Higher Ketosis | >1.5 |
Metabolic Perspective
A common positive shift during successful weight management is:
- HbA1c slowly decreasing
- Ketones modestly increasing
This often reflects improved metabolic efficiency and greater ability to access stored body fat as energy.
Triglycerides
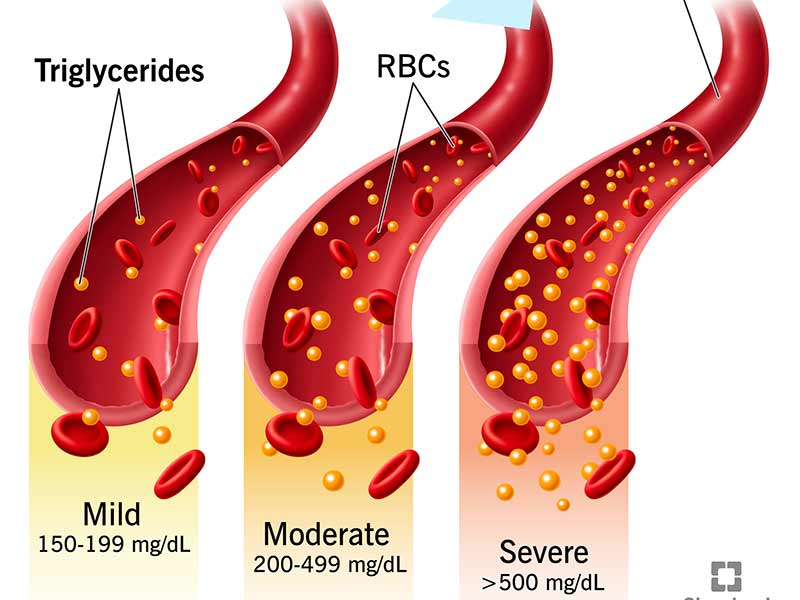
Triglycerides are blood fats heavily influenced by excess calorie intake, processed carbohydrates, sugar, alcohol and inactivity. Elevated triglycerides are one of the strongest markers of metabolic syndrome and poor carbohydrate tolerance.
Many individuals struggling with weight management present with elevated triglycerides alongside higher HbA1c and abdominal fat accumulation.
| Classification | Result |
|---|---|
| Excellent | <1.0 |
| Normal | 1.0–1.7 |
| Worth Reviewing | 1.8–2.5 |
| Higher Risk | >2.5 |
Metabolic Perspective
Lower triglycerides often reflect:
- Improved food quality
- Better carbohydrate management
- Reduced liver stress
- Improved insulin sensitivity
- Better fat metabolism
Uric Acid
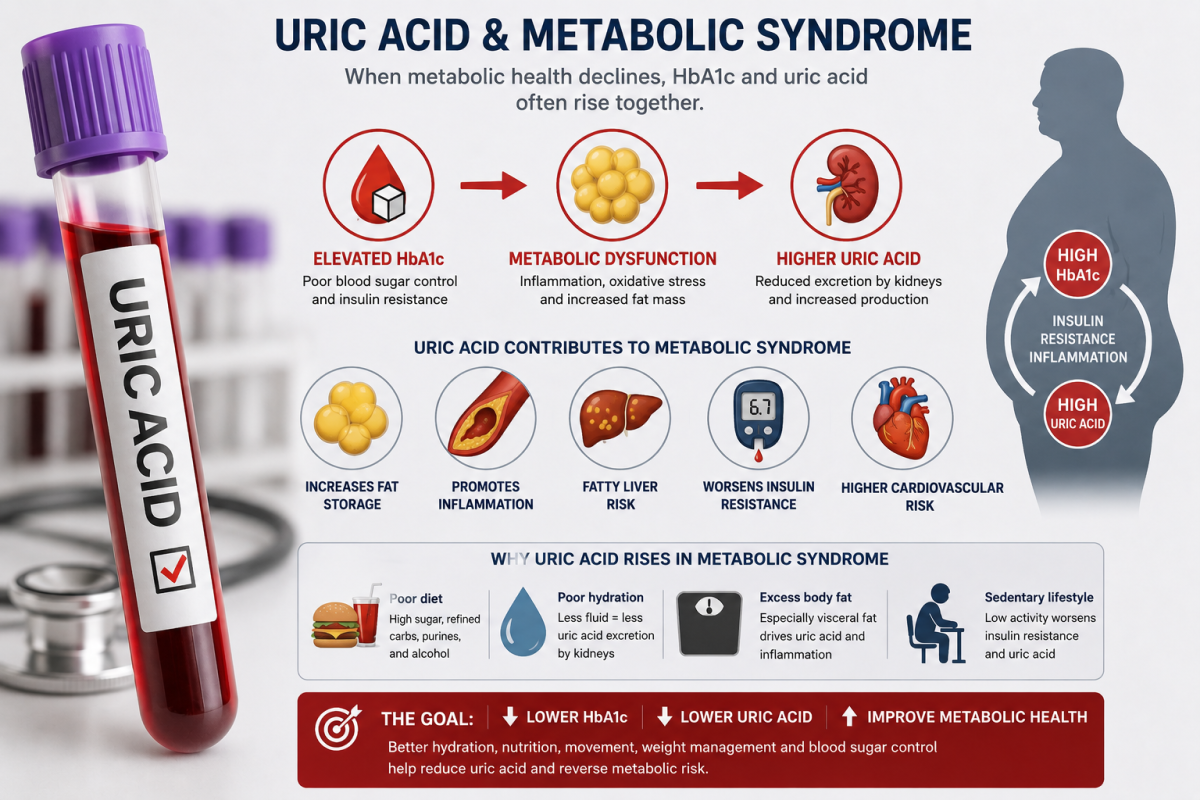
Uric acid reflects how the body handles metabolic waste products. Elevated levels are commonly associated with dehydration, excess processed food intake, alcohol, metabolic syndrome and increasing insulin resistance.
Higher uric acid frequently travels alongside elevated triglycerides, abdominal fat gain and poorer metabolic health.
| Classification | Result |
|---|---|
| Good | 4.0–6.0 |
| Normal | 6.0–7.0 |
| Worth Reviewing | >7.0 |
| Classification | Result |
|---|---|
| Good | 3.5–5.5 |
| Normal | 5.5–6.5 |
| Worth Reviewing | >6.5 |
Metabolic Perspective
Improving hydration, reducing processed food intake, improving insulin sensitivity and increasing physical activity commonly help improve uric acid levels over time.
Overall Philosophy
Metabolic testing is not about embarrassment, guilt or perfection.
It is about understanding:
- How efficiently the body currently manages fuel
- Whether the body is storing or utilising energy effectively
- Whether inflammation and metabolic stress may be building quietly underneath the surface
Importantly:
The body can improve remarkably quickly.
Many people begin their journey with:
- Higher HbA1c
- Low ketones
- Elevated triglycerides
- Reduced muscle ratios
Yet within months, these numbers often shift dramatically with:
- Better food quality
- Improved sleep
- Resistance exercise
- Walking and daily movement
- Reduced processed food intake
- Improved consistency
The body is incredibly adaptable when given the right environment.